Transparent results across strategies, backed by consistent execution and measurable outcomes.
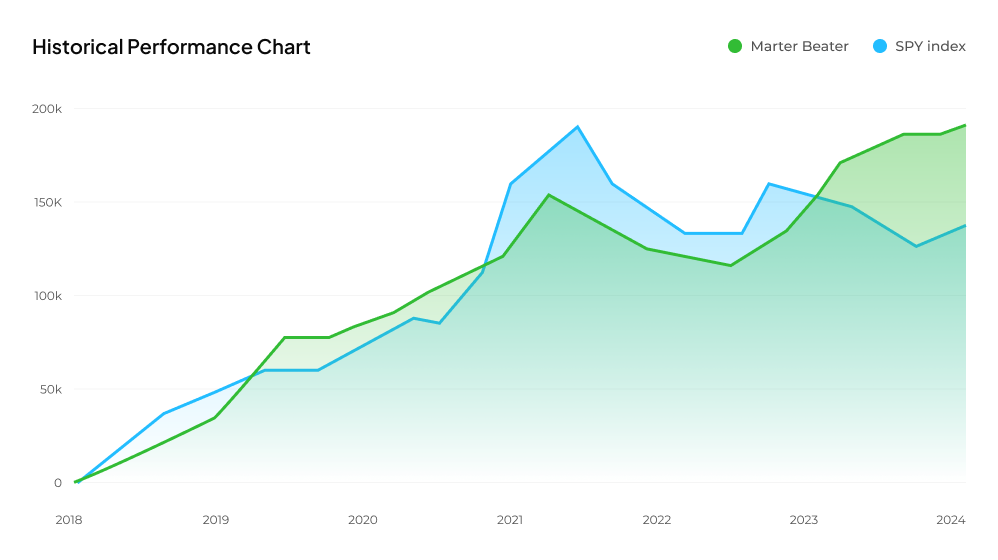
Explore the historical performance of our investment strategies and see how we’ve consistently outperformed the market over time.
| Stock | Entry Price | Exit Price | Stock ROI |
|---|---|---|---|
|
AMCR
Amcor Plcs
|
$48.44 | $38.19 | -21.2% |
|
LRCX
Lam Research Corp
|
$233.22 | $198.05 | -15.1% |
|
MU
Micron Technology Inc
|
$410.99 | $314.37 | -23.5% |
|
NEM
Newmont Corporation
|
$130.15 | $102.34 | -21.4% |
|
STX
Seagate Technology Holdings Plcs
|
$406.55 | $356.63 | -12.3% |
|
WDC
Western Digital Corp.
|
$279.39 | $246.99 | -11.6% |
|
SPY
S&P 500 ETF (Benchmark)
|
$685.99 | $650.34 | -5.2% |
| Stock | Entry Price | Exit Price | Stock ROI |
|---|---|---|---|
|
AMCR
Amcor Plcs
|
$44.35 | $48.44 | +9.2% |
|
LRCX
Lam Research Corp
|
$232.91 | $233.22 | +0.1% |
|
MU
Micron Technology Inc
|
$420.90 | $410.99 | -2.4% |
|
NEM
Newmont Corporation
|
$113.13 | $130.15 | +15.0% |
|
STX
Seagate Technology Holdings Plcs
|
$407.62 | $406.55 | -0.3% |
|
WDC
Western Digital Corp.
|
$250.00 | $279.39 | +11.8% |
|
SPY
S&P 500 ETF (Benchmark)
|
$691.97 | $685.99 | -0.9% |
| Stock | Entry Price | Exit Price | Stock ROI |
|---|---|---|---|
|
LRCX
Lam Research Corp
|
$173.80 | $232.91 | +34.0% |
|
MU
Micron Technology Inc
|
$292.85 | $420.90 | +43.7% |
|
NEM
Newmont Corporation
|
$101.34 | $113.13 | +11.6% |
|
STX
Seagate Technology Holdings Plcs
|
$279.66 | $407.62 | +45.8% |
|
WBD
Warner Bros Discovery Inc
|
$28.73 | $27.53 | -4.2% |
|
WDC
Western Digital Corp.
|
$175.73 | $250.00 | +42.3% |
|
SPY
S&P 500 ETF (Benchmark)
|
$681.92 | $691.97 | +1.5% |
| Stock | Entry Price | Exit Price | Stock ROI |
|---|---|---|---|
|
AVGO
Broadcom Inc
|
$402.30 | $349.65 | -13.1% |
|
MU
Micron Technology Inc
|
$237.08 | $292.85 | +23.5% |
|
PLTR
Palantir Technologies Inc
|
$169.03 | $180.52 | +6.8% |
|
STX
Seagate Technology Holdings Plcs
|
$277.20 | $279.66 | +0.9% |
|
WBD
Warner Bros Discovery Inc
|
$24.00 | $28.73 | +19.7% |
|
WDC
Western Digital Corp.
|
$163.81 | $175.73 | +7.3% |
|
SPY
S&P 500 ETF (Benchmark)
|
$683.39 | $681.92 | -0.2% |
| Stock | Entry Price | Exit Price | Stock ROI |
|---|---|---|---|
|
APP
AppLovin Corp
|
$624.40 | $600.05 | -3.9% |
|
MU
Micron Technology Inc
|
$228.57 | $237.08 | +3.7% |
|
PLTR
Palantir Technologies Inc
|
$197.20 | $169.03 | -14.3% |
|
STX
Seagate Technology Holdings Plcs
|
$275.31 | $277.20 | +0.7% |
|
TPR
Tapestry, Inc.
|
$111.36 | $109.28 | -1.9% |
|
WBD
Warner Bros Discovery Inc
|
$22.45 | $24.00 | +6.9% |
|
SPY
S&P 500 ETF (Benchmark)
|
$682.06 | $683.39 | +0.2% |
| Stock | Entry Price | Exit Price | Stock ROI |
|---|---|---|---|
|
APP
AppLovin Corp
|
$716.36 | $624.40 | -12.8% |
|
GEV
Ge Vernova Inc.
|
$600.55 | $577.75 | -3.8% |
|
PLTR
Palantir Technologies Inc
|
$178.31 | $197.20 | +10.6% |
|
STX
Seagate Technology Holdings Plcs
|
$229.00 | $275.31 | +20.2% |
|
TPR
Tapestry, Inc.
|
$112.00 | $111.36 | -0.6% |
|
WBD
Warner Bros Discovery Inc
|
$18.71 | $22.45 | +20.0% |
|
SPY
S&P 500 ETF (Benchmark)
|
$666.18 | $682.06 | +2.4% |
| Stock | Entry Price | Exit Price | Stock ROI |
|---|---|---|---|
|
APP
AppLovin Corp
|
$477.99 | $716.36 | +49.9% |
|
GEV
Ge Vernova Inc.
|
$613.00 | $600.55 | -2.0% |
|
PLTR
Palantir Technologies Inc
|
$156.37 | $178.31 | +14.0% |
|
TPR
Tapestry, Inc.
|
$102.24 | $112.00 | +9.6% |
|
UAL
United Airlines Holdings, Inc.
|
$105.80 | $98.96 | -6.5% |
|
VST
Vistra Corp.
|
$189.00 | $198.68 | +5.1% |
|
SPY
S&P 500 ETF (Benchmark)
|
$645.05 | $666.18 | +3.3% |
| Stock | Entry Price | Exit Price | Stock ROI |
|---|---|---|---|
|
APP
AppLovin Corp
|
$374.07 | $477.99 | +27.8% |
|
AXON
Axon Enterprise Inc
|
$748.25 | $747.90 | -0.1% |
|
GEV
Ge Vernova Inc.
|
$665.02 | $613.00 | -7.8% |
|
PLTR
Palantir Technologies Inc
|
$159.80 | $156.37 | -2.2% |
|
TPR
Tapestry, Inc.
|
$106.64 | $102.24 | -4.1% |
|
VST
Vistra Corp.
|
$209.60 | $189.00 | -9.8% |
|
SPY
S&P 500 ETF (Benchmark)
|
$632.08 | $645.05 | +2.1% |
| Stock | Entry Price | Exit Price | Stock ROI |
|---|---|---|---|
|
APP
AppLovin Corp
|
$335.59 | $374.07 | +11.5% |
|
AXON
Axon Enterprise Inc
|
$817.80 | $748.25 | -8.5% |
|
DASH
DoorDash Inc
|
$242.00 | $245.54 | +1.5% |
|
GEV
Ge Vernova Inc.
|
$519.75 | $665.02 | +28.0% |
|
HWM
Howmet Aerospace Inc.
|
$182.46 | $192.00 | +5.2% |
|
PLTR
Palantir Technologies Inc
|
$134.51 | $159.80 | +18.8% |
|
SPY
S&P 500 ETF (Benchmark)
|
$617.85 | $632.08 | +2.3% |
| Stock | Entry Price | Exit Price | Stock ROI |
|---|---|---|---|
|
APP
AppLovin Corp
|
$390.60 | $335.59 | -14.1% |
|
AXON
Axon Enterprise Inc
|
$747.00 | $817.80 | +9.5% |
|
GEV
Ge Vernova Inc.
|
$473.00 | $519.75 | +9.9% |
|
HWM
Howmet Aerospace Inc.
|
$170.31 | $182.46 | +7.1% |
|
MSTR
|
$369.25 | $404.23 | +9.5% |
|
PLTR
Palantir Technologies Inc
|
$130.28 | $134.51 | +3.3% |
|
SPY
S&P 500 ETF (Benchmark)
|
$589.39 | $617.85 | +4.8% |
| Stock | Entry Price | Exit Price | Stock ROI |
|---|---|---|---|
|
APP
AppLovin Corp
|
$284.98 | $390.60 | +37.1% |
|
GEV
Ge Vernova Inc.
|
$370.06 | $473.00 | +27.8% |
|
HWM
Howmet Aerospace Inc
|
$136.35 | $170.31 | +24.9% |
|
MSTR
MicroStrategy Inc
|
$369.25 | $369.25 | 0.0% |
|
PLTR
Palantir Technologies Inc
|
$114.65 | $130.28 | +13.6% |
|
TPL
Texas Pacific Land Corporation
|
$1,350.38 | $1,110.14 | -17.8% |
|
SPY
S&P 500 ETF (Benchmark)
|
$554.54 | $589.39 | +6.3% |
| Stock | Entry Price | Exit Price | Stock ROI |
|---|---|---|---|
|
APP
AppLovin Corp
|
$264.88 | $284.98 | +7.6% |
|
GEV
Ge Vernova Inc.
|
$302.93 | $370.06 | +22.2% |
|
HWM
Howmet Aerospace Inc
|
$129.69 | $136.35 | +5.1% |
|
PLTR
Palantir Technologies Inc
|
$85.85 | $114.65 | +33.6% |
|
TPL
Texas Pacific Land Corporation
|
$1,305.71 | $1,350.38 | +3.4% |
|
TRGP
Targa Resources Corp
|
$197.82 | $179.25 | -9.4% |
|
SPY
S&P 500 ETF (Benchmark)
|
$559.39 | $554.54 | -0.9% |
The above values represent the combined return on investment for the selected time period. "Market Beater" shows the total ROI of our stock picks, "SPY" shows the S&P 500 ETF performance for the same period, and "Outperformance" is the difference between the two.
Explore the historical performance of our investment strategies and see how we’ve consistently outperformed the market over time.
Market Beater: $36,704
SPY Index: $2,175
Market Beater: $3,058
SPY Index: $178
Market Beater: 38%
SPY Index: 11.66%
Market Beater: 354.54%
SPY Index: 19.14%
We provide services around investing that aim to deliver the best possible return for our users. We always do our best to make sure that those services perform better than.